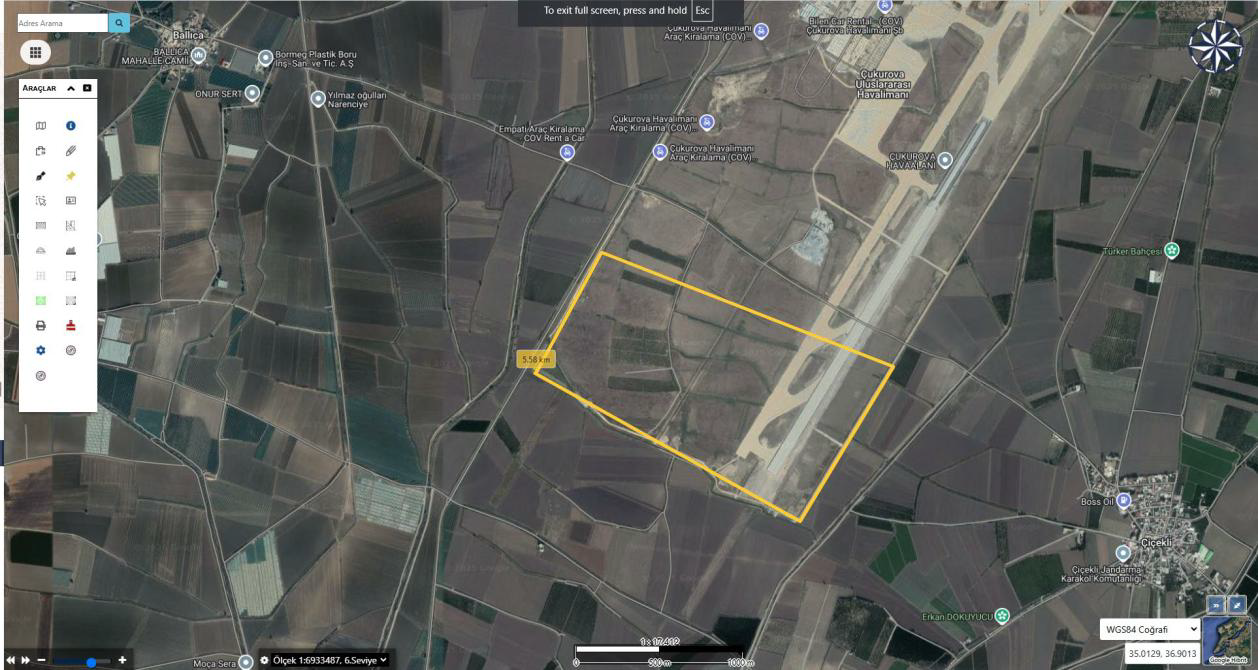
Main Map View
The main map interface where users can view geographic data across Turkey. Layer selection, zooming, measurement, and location determination are performed on this screen. Scale, coordinates, and direction information can be tracked instantly.
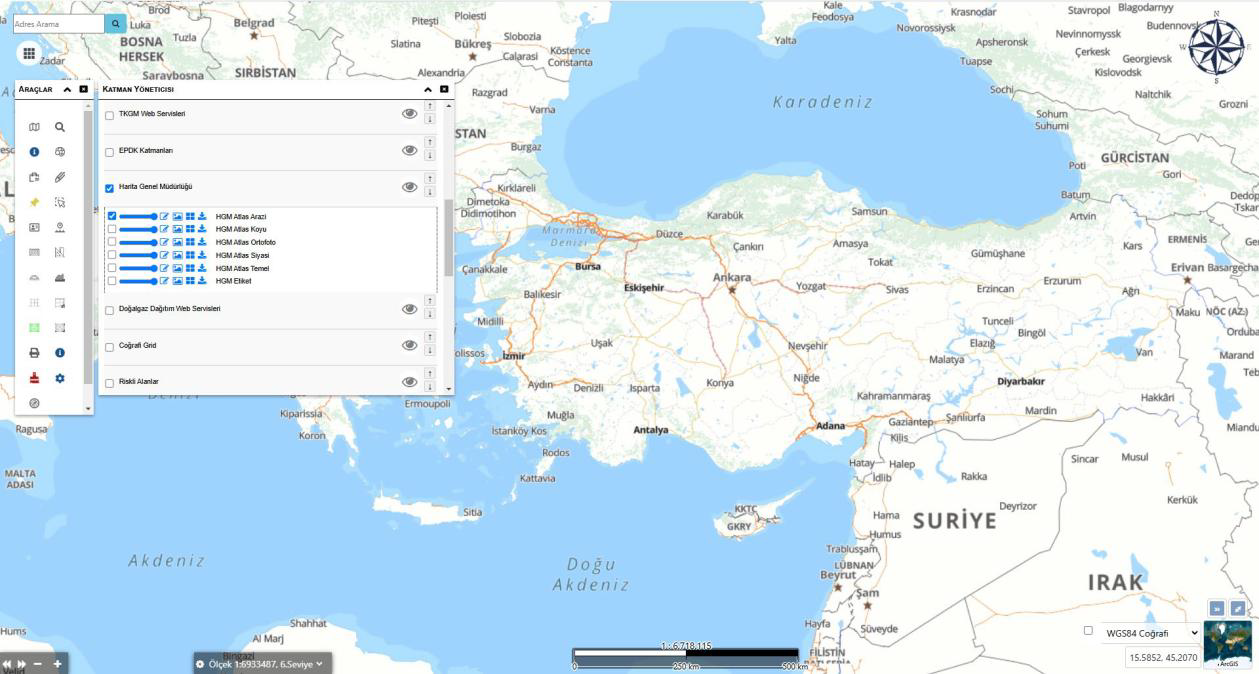
Layer Management Screen
Allows users to view, toggle, order, and adjust the transparency of all data layers on the map. Data from institutional services such as HGM, TKGM, and EPDK can be managed on a single screen, enabling integrated display of map data from different sources.

Layer Ordering and Visibility Screen
This screen manages the active status, visibility, and ordering of all data layers on the map. The user can reorder layers by drag-and-drop, toggle visibility with a single click, and make changes permanent with the "Save Ordering" button.
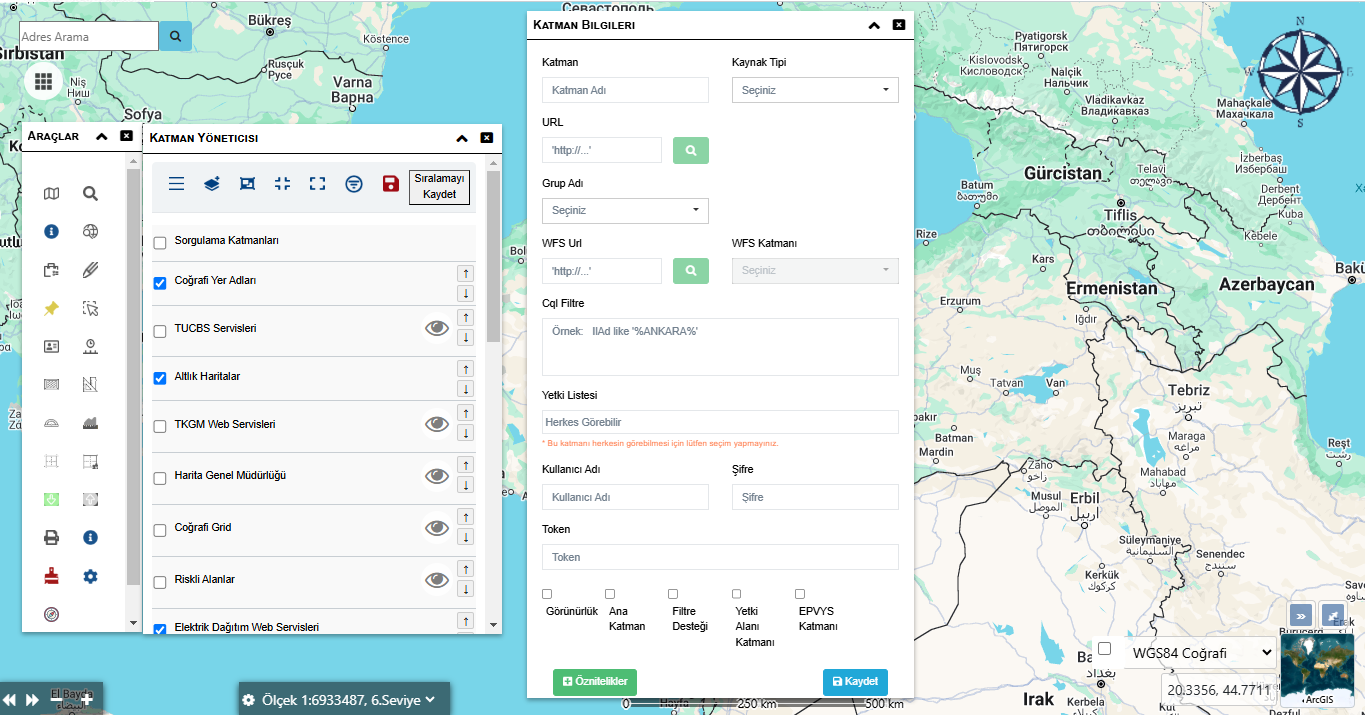
Layer Information Screen
Adding new layers or editing connection settings for existing layers is done on this screen. The user can integrate institutional data services into the system by defining layer name, source type, URL, WFS information, permission list, and visibility options.
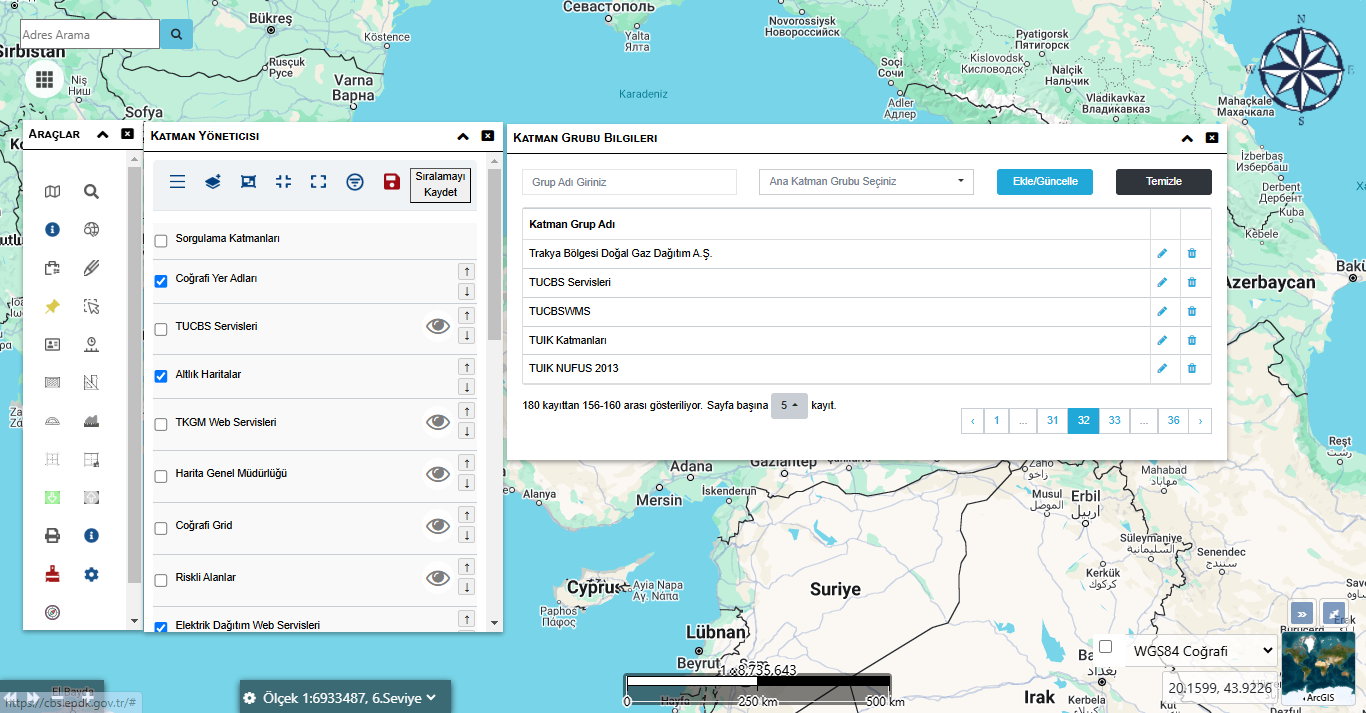
Layer Group Information Screen
This screen is where layer groups are defined and managed for more organized map data. The user can add new groups, update existing groups, or delete them; institution-based or thematic layer groups can be created.

Quick Query Screen
This screen is used to query data based on license, facility, and coordinate information. The user can enter criteria such as license number, facility type, coordinate area, and approval status to quickly filter records in the database and access up-to-date results.
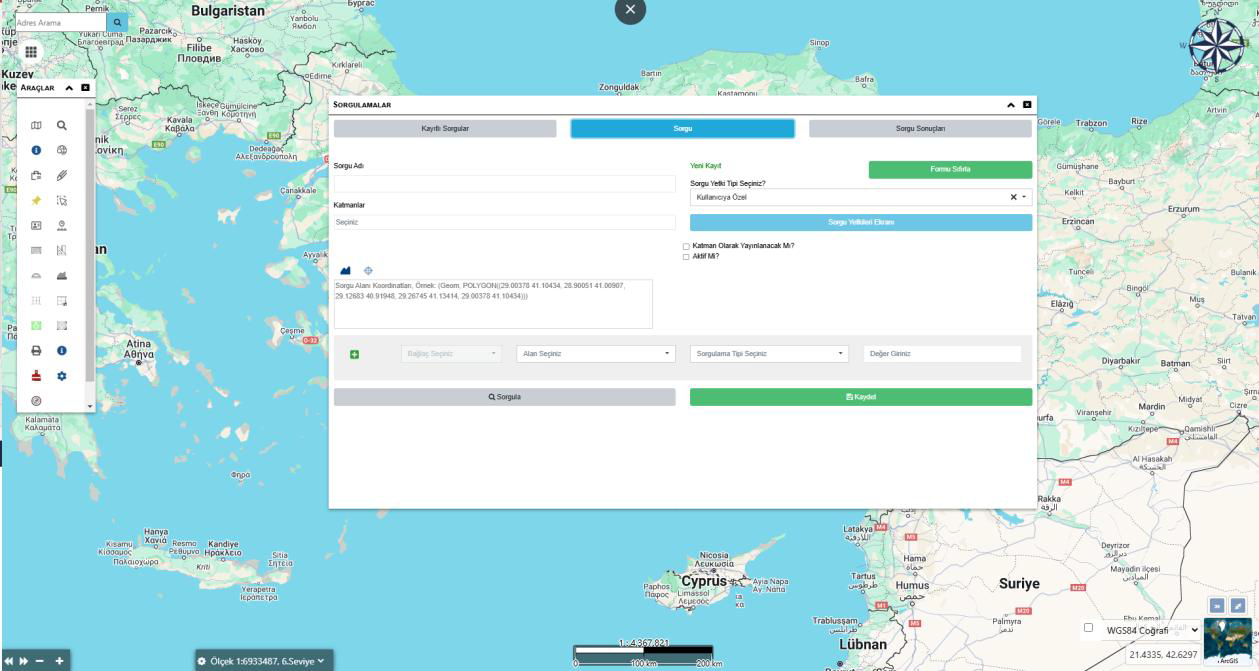
Query Screen
This screen allows the user to filter and analyze data for a specific area or layer on the map. Queries can be saved with user or institution-based authorization; special analyses can be created by defining geometric area selection, query type, and conditions.
Drawing Tool Screen
This screen allows users to define areas by drawing polygon, line, or point-based geometries on the map. Drawn areas can be used directly in measurement, analysis, or querying and can be saved to layers to integrate with project-based data management.
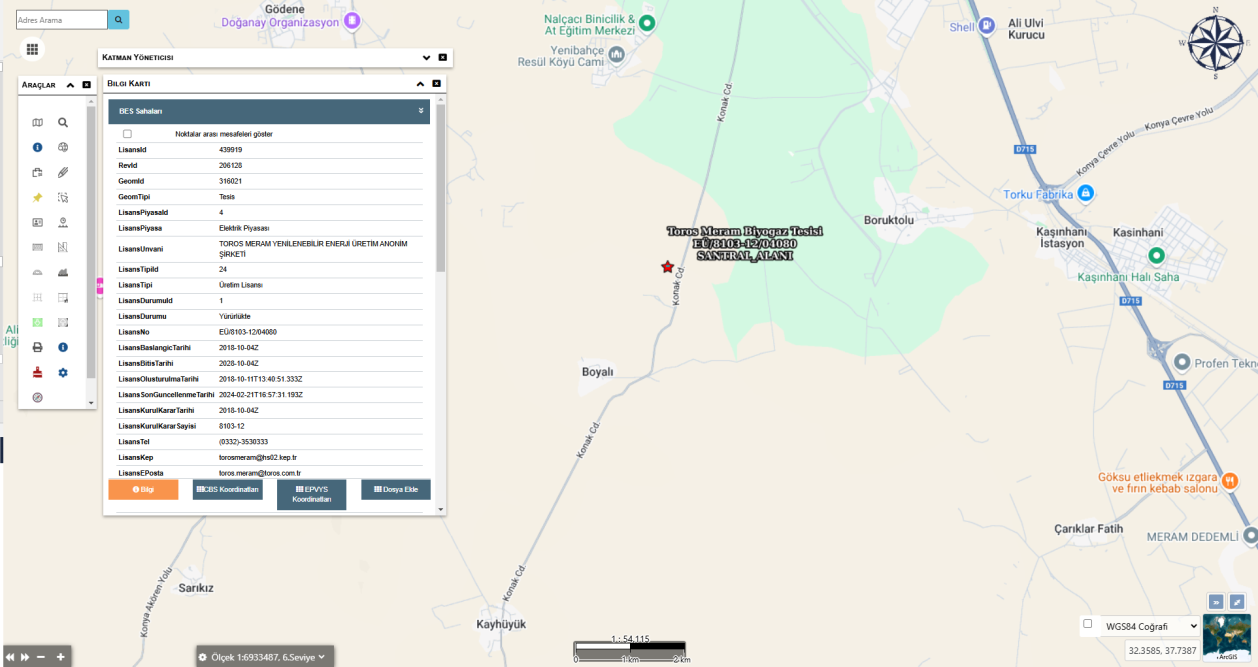
Info Card Screen
This screen lists all detailed information for the selected facility, parcel, or object. The user can view license, coordinates, status, date, and document information; and can also upload files related to the record, show coordinates, or download documents directly from here.
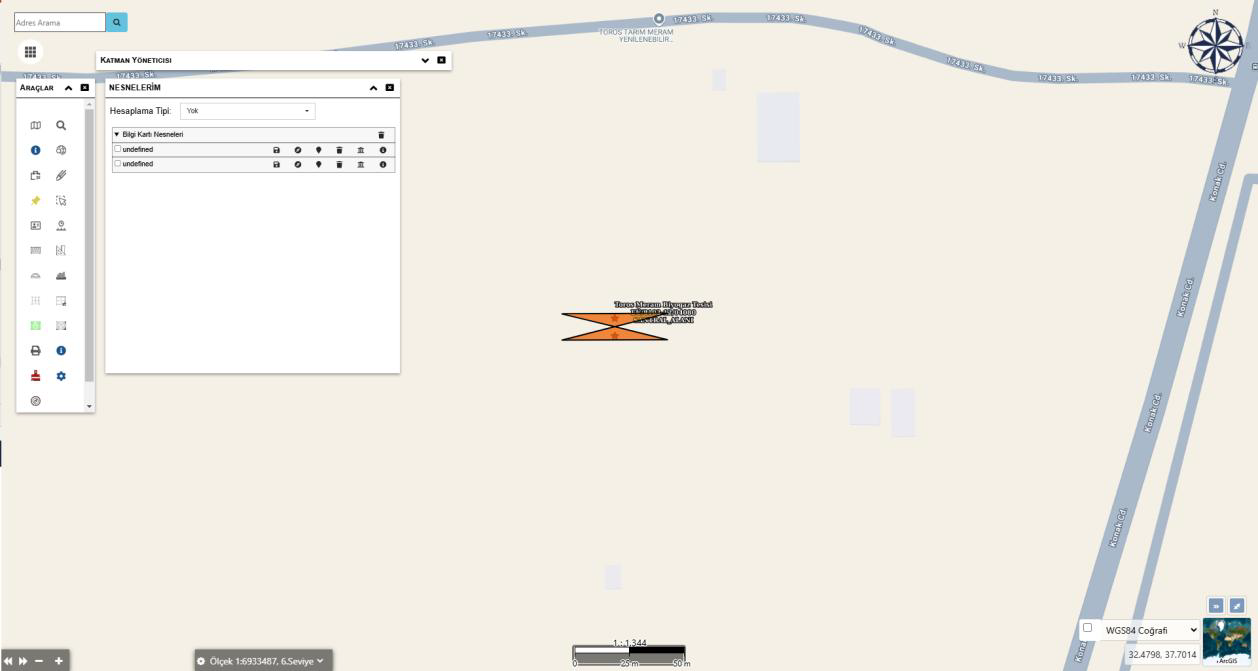
Object Management Screen
This screen allows users to manage objects they created or viewed on the map. For each object, visibility, style, info card access, coordinate display, and deletion operations can be performed; thus, users can manage their own data layers in an orderly and controlled manner.
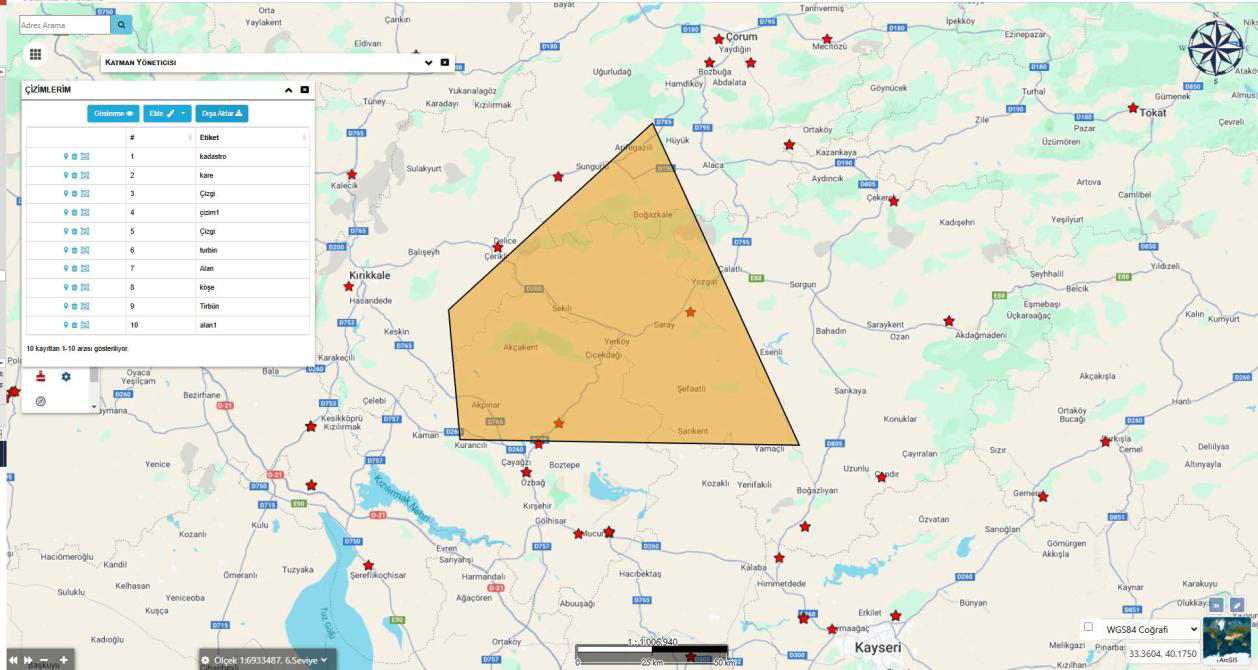
My Drawings Screen
This screen lists and manages all drawings (point, line, area, etc.) created on the map. Each drawing can be edited, deleted, or exported; thus users can systematically save and reuse their field data.
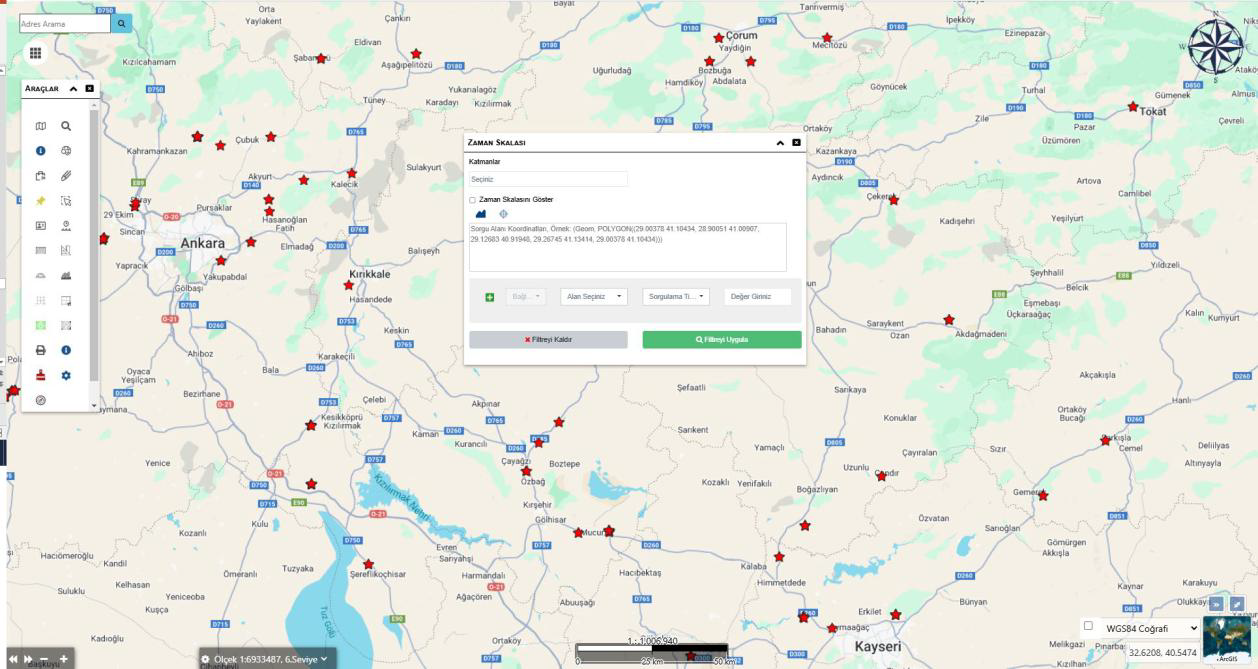
Time Scale Screen
Enables viewing map data across time. The user can filter layers by a date range, analyze change processes, and compare spatial distributions of past data.
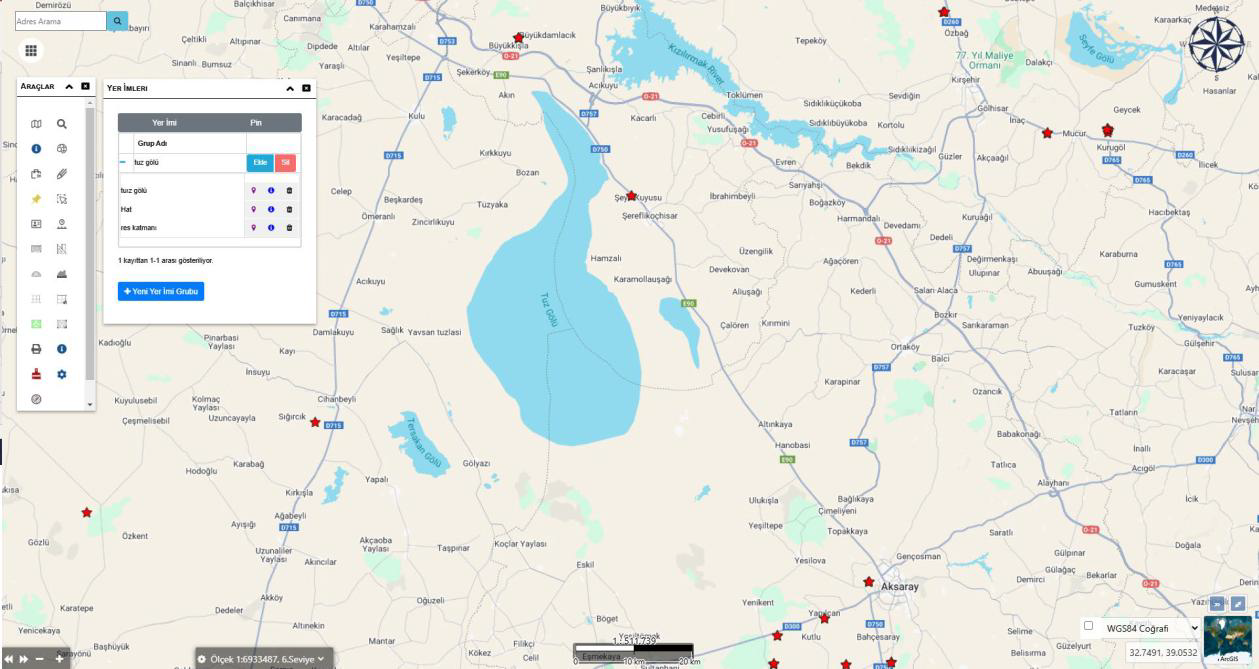
Bookmarks Screen
This screen lets users mark and save specific locations on the map. Locations can be categorized by creating different bookmark groups; thus frequently used points or important areas can be quickly viewed and organized.
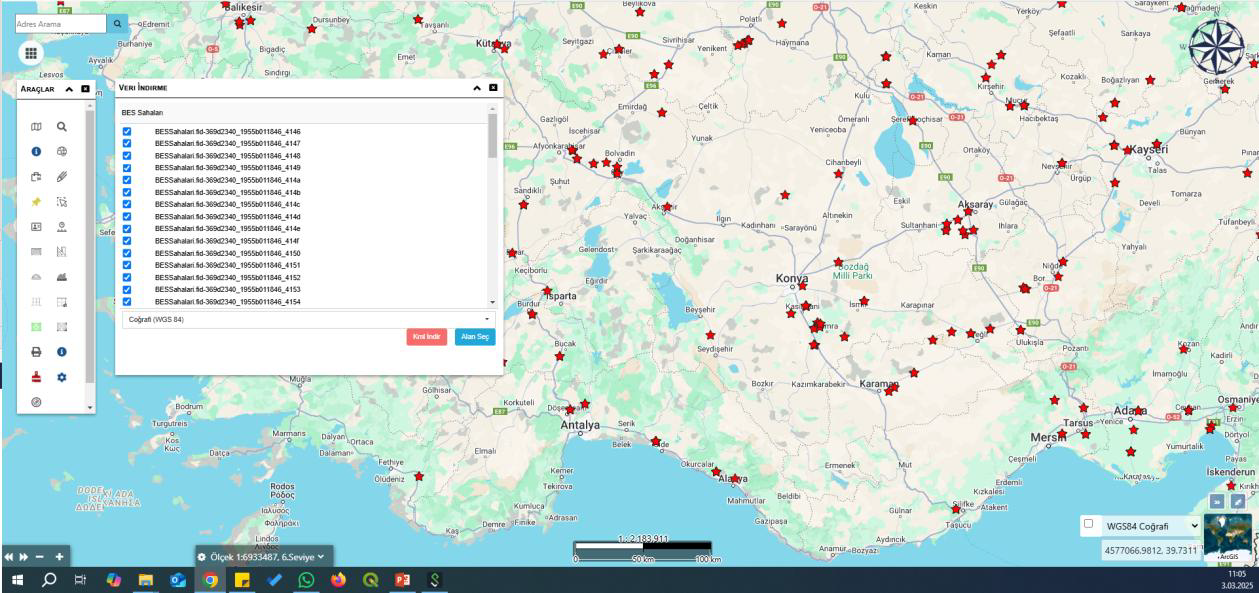
Data Download Screen
Enables exporting data for selected layers or objects on the map in KML format. The user can select a geographic coordinate system and quickly download data for use in external GIS software or field applications.
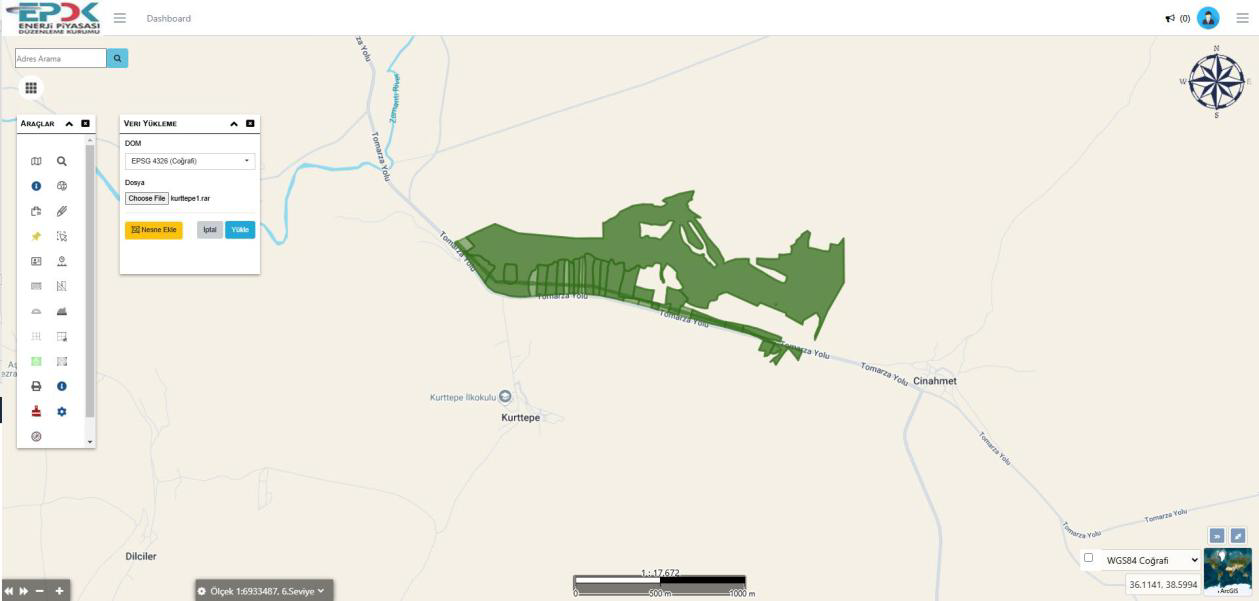
Data Upload Screen
This is where users can upload new datasets (e.g., .shp, .kml, .rar, .geojson) to the GIS environment. With file upload, the layer is automatically added to the map and can be viewed and analyzed immediately by the user.